Various processes in natural sciences, such as the geometric shape of shores, rocks, plants or waves, the trajectories of living beings, atmospheric flows and myriad other phenomena seem to present a high level of complexity. That complexity, even if belonging to very different areas, may nonetheless have patterns related to each other.
Examples as shapes, trajectories or flows may initially seem complex, but their underlying structures can become in fact a source of simplicity and of clarity. Seemingly complex systems can be explained by a relatively small set of parameters, once they are referred to a well-known structural element or pattern.

In neuroscience, one such example is that of the temporal variations of electroencephalography (EEG) signals. Such signals show long-range correlations over different time scales. In this case, the phenomenon indicates the presence of self-invariant and self-similar structures. Such complex structures can be captured with procedures of non-linear analysis, as well as with compression methods, such as the Lempel-Ziv complexity algorithm (LZc).
The LCz algorithm is a method based on looking for repeating patterns in the data. Instead of describing the data using all initial information, which may be rather complex, it summarizes it using the underlying unique patterns. Thus, using LZc, each signal can be described using less information and therefore appear to be less complex than initially observed.
How is complexity related to consciousness, intelligenge or brain disorders?
There is not an exact definition of what complexity of the brain activity exactly is. While several approaches can be taken to give such a definition, there is a question that is rather essential and of much interest to us, yet not fully answered. It is the following three-layered question: how does complexity change in the brain, what does it depend on, and how is it related to consciousness, intelligence, wisdom or brain disorders?
While we still do not know exactly how brain complexity works, there have been several scientific studies that tackle the problem in various scenarios. For instance, from some research findings, it seems that stroke, schizophrenia, and depression patients have higher LZc complexity on both a spontaneous and a cognitive task-related EEG activity compared to age-matched healthy controls. On the other side of the coin, spontaneous EEG complexity seems to decrease during anesthesia, NREM sleep, as well as in Unresponsive Wakefulness Syndrome (UWS), Minimal Conscious State (MCS) or Emergence from MCS (EMCS) patients, and Locked-in syndrome (LIS) patients.
Further, complexity seems to decrease in disturbances as schizophrenia or depression, but also in healthy control subjects when they are performing a mental arithmetic task, when compared to their resting state EEG records. Some of these findings are also supported by studies of magnetoencephalography (MEG). For instance, schizophrenia patients seem to have higher LZc complexity if compared to healthy controls, something also found in their MEG signals. On the other hand, depressed patients seem to have higher MEG pre-treatment complexity, yet showing a decrease after 6 months of pharmacological treatment (antidepressants). Although MEG and EEG refer to two distinct types of brain signals, it seems that the underlying complexity patterns found follow a similar behavior.
Other MEG studies have revealed decreased complexity in MEG signals in Alzheimer patients when compared to age-matched healthy controls. On the other hand, complexity was found to increase until the sixth decade of life in healthy subjects, but starts decreasing after this age. The same study concluded that in females complexity was higher than in males. Finally, a recent MEG study showed that the complexity is increased during a psychedelic state of consciousness induced using ketamine, LSD or psilocybin, if compared to placebo.
What is the meaning of the experimental findings?
After all the previous information, what can be said about what is happening in the brain in all such conditions? What is it that in some cases gives way brain signal complexity increases, whereas in other cases a decrease takes place? Let’s explain some of the cases below.
Let’s begin with the decrease in complexity of a person doing a simple arithmetic task. Why would complexity decrease? For this, a possible explanation is that the decrease in complexity may be related to an increase in synchronization during the mental activity, which typically reflects the state of internal concentration. So, the more concentrated, the better the brain is at being organized, which in turn results in lower complexity.
Regarding schizophrenia and depression patients, complexity seems to be higher than in healthy individuals even during the performing of arithmetic tasks. The higher complexity found may be due in both disorders to an increase in neuron participation in the processing of information. It thus seems that to perform the same task, schizophrenia and depressive patients use more neurons. The same study found that schizophrenia patients had higher complexity levels, with depressed individuals having complexity levels closer to those of healthy individuals.
The previous suggests that information processing in schizophrenia patients may require the participation of more neurons or connections between them, if compared to both healthy controls and depressive patients. But would this imply that increased complexity always reflects some kind of deficit? The answer to this is: not at all.
As previously indicated, studies have found increasing complexity with age in healthy subjects until the age of sixty, and decreasing complexity later on, as well as increased complexity in females when compared to males. These findings may be the result of capturing the phenomenon of the continuous formation and maturation of the neuronal assemblies, and the development of cortico-cortical connections of neural assemblies with age, someting that starts decreasing after middle age.
The proposed rationale would coincide with the myelination of cortical white matter development with age, which is involved in the cortico-cortical connections. Specifically, the cortical white matter increases until it reaches a peak at around the fourth decade of life, and then it decreases. This behavior has, in fact, been confirmed by various brain imaging studies.
The previous explanation, however, doesn’t mean that only if there are changes in brain white matter there will be changes in complexity. It would rather indicate that changes in white matter can provoke changes in cortical complexity. So far, there have been no observations of differences in white matter between males and females. Relatedly, the increased complexity observed in females compared to males is even more difficult to address.
Increased complexity was also found during a psychedelic state induced using ketamine, LSD, and psilocybin. In this case, the explanation seems related to the perception of richer, more expansive and diverse scenes, according to participant reports. An increase in neuron participation and higher connectivity across them due to the increase in sensory information could be the cause. In connection to this, as the surroundings is described by the individual as “enhanced” and more diverse, additional neuronal mechanisms would need to take place to perceive it.
Additionally, the authors of that same article suggested that this could be related to the bridging of the gap between “conscious content” (consciously perceived elements or experiences) and conscious level (the level of consciousness). In other words, this could be related to the appearance of more fully conscious levels, hence more capable of perceiving (consciously) more or more complex stimuli.
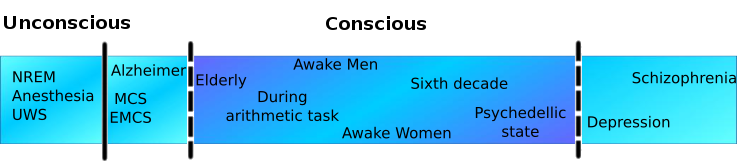
Middle: healthy, unaltered states. To the left, decreased consciousness states. To the right, distrubances that influence brain complexity. Increasing complexity levels from left to right.
Let’s see next what happens in the cases in which complexity decreases. As discussed previously, complexity decreases were found in dreaming, NREM, MCS, LIS, and anesthesia-induced states. Research carried out in that regard used a perturbation-driven protocol to trigger a response, and then measured the response through its complexity. Among these stages, the estimated metric of complexity, namely the perturbation complexity index (PCI; based on LZc), behaved the same way regardless of whether the loss of consciousness was due to a physiological process or due to a pharmacological intervention.
It was thus found that NREM sleep stages, induced anesthesia, and unresponsive wakefulness syndrome patients resulted in similar complexity values lower than those of minimal conscious state (MCS) or emergence from minimal consciousness state (EMCS), that have in turn lower complexity than the awake healthy controls. The complexity, as estimated in this case, measures both the information content and the integration of the output of the corticothalamic system, as explained by the authors.
So, what should one aim for: high or low brain complexity? The presented figure attempts to represent visually the differences in complexity level with respect to various states. As with everything else in life, it seems that neither too much nor too little complexity in the brain serves one right on well-being, as can be seen from the location of healthy and unhealthy profiles found along the complexity spectrum.
There is still much room left for understanding the whole picture of complexity in the human brain, as there are still missing relationships in the complexity spectrum, but don’t worry… We are working on that! If you are interested in the concept, have a look at some more details about the Luminous project for studying, measuring and modifying consciousness. Keep an eye out for new findings resulting from our work! I hope this post helps you wrap your mind around the complex matter of complexity.
This post was originally written by team member Eleni Kroupi, and published at the Neuroelectrics website blog. It has been reproduced here with permission with some edition for the sake of clarity and adaptation to the format.
Image credits:
River wave patterns picture was downloaded from Flickr and licensed via a Creative Commons Attribution-ShareAlike 2.0 Generic (CC BY-SA 2.0) license.
Elderly woman picture was downloaded from Maxpixel and is in the public domain.
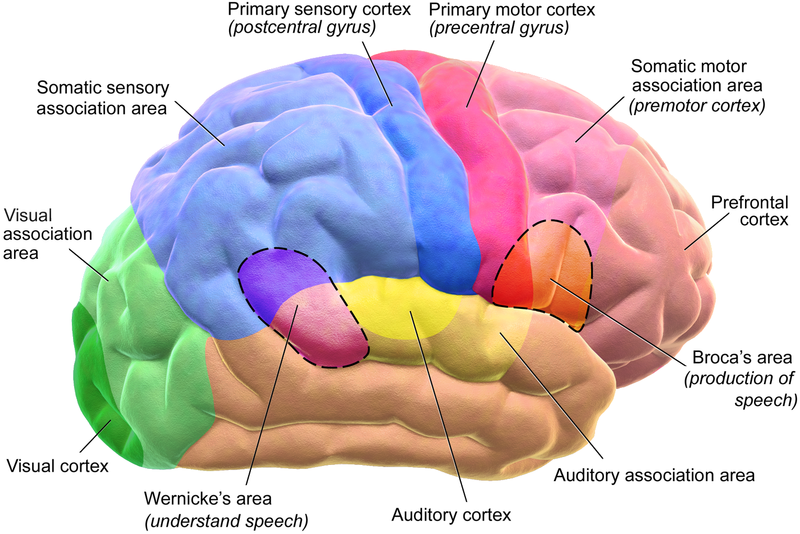
Diagram Functional areas of the human brain was downloaded from Wikipedia and licensed via a Creative Commons Attribution 3.0 Unported (CC BY 3.0) license.
.png)
The diagram with the representation of relative complexity in function of diverse conditions was re-drawn from the analogous diagram at the original article.